Object Groups Report
This article will focus on the Object Groups Report.
NP-View uses reports to present network information related to the open workspace. These reports are available to all users and can be accessed from the main menu. For more information visit the Workspace Reports Overview article.
Object Groups – Defined
- Object Groups classify users, devices, or protocols into “groups” and apply those groups to Access Control Lists (ACLs), to create access control policies for those groups.
- The Object Groups report provides a summary of Network ACL Object Groups.
- These object groups may include: Host IP addresses, network address of group members, and nested object groups.
- Objects consist of several types including Address, Service, Binding, Interface, and Zone.
The Object Groups Report can be accessed in two ways. Each way presents a different data set.
- From the main menu, the table will populate the table with all objects for all devices in the workspace, including globals.
- From the topology, when clicking a Firewall/ Router/ Switch – its info panel will open – and the user can select Object Groups from the Data for this Device section. Only the objects for the selected device will be displayed in this case.
*main menu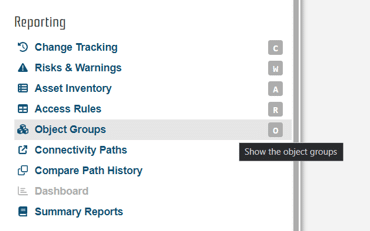 *info panel
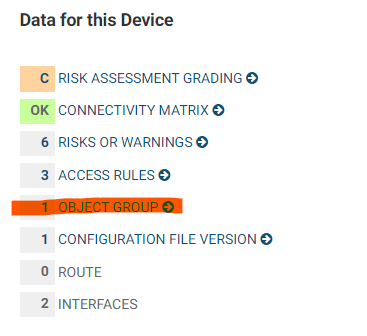
Network Management System:
When data is loaded from a firewall vs Network Management system, the listing of object groups for addresses may vary.
- When viewing data from a network management system, globally defined groups may be available.
- When the data is loaded from the firewall, the global addresses may be presented as local addresses.
What Data is Present?
The list below the image details the data types available in the Object Groups Report.
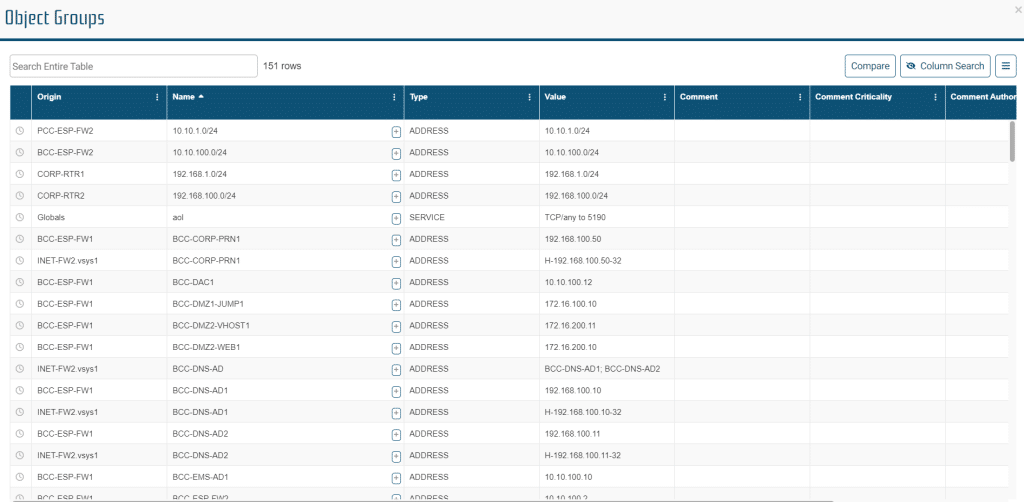
Table Actions
There are a number of actions that can be taken in the Object Groups report, some are specific to Object Groups, others are universal to all Reports.
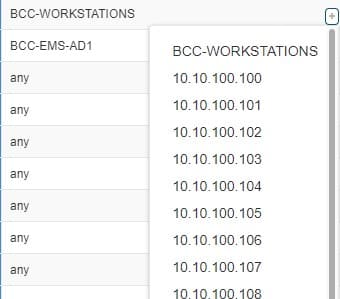
- Overflow Data: When there is more data in a Cell than can be presented in a column, the overflow data can be accessed by clicking the + icon in the cell.
- Object Group Details: The name column will show related object data details within the + popup.
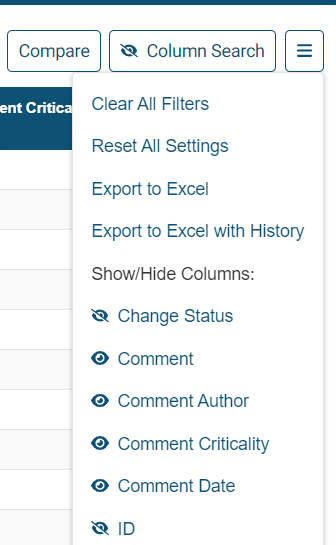
- Columns can be displayed or hidden using the hamburger menu in the upper right corner of the report.
- Changes to the menu are automatically saved.
- Additionally, the table can be exported as displayed, with comment history or with object groups.
- Only visible columns will be displayed.
- Columns can be sorted, rearranged or resized and changes will be automatically saved.
- Column filters can be displayed.
- Filters applied to the table or column will automatically be saved.
- Filters can be reset from the hamburger menu.
*the Object Groups Report Menu
Comments
NP-View provides a simple and easy way for users to add comments to Object Groups, and to track the historical lineage of these comments in a workspace. Comments can be added, or viewed, but for for integrity purposes they cannot be edited or deleted by users. If an Object Group is changed or removed from the system, the group and associated comments will be removed from the Object Group table.
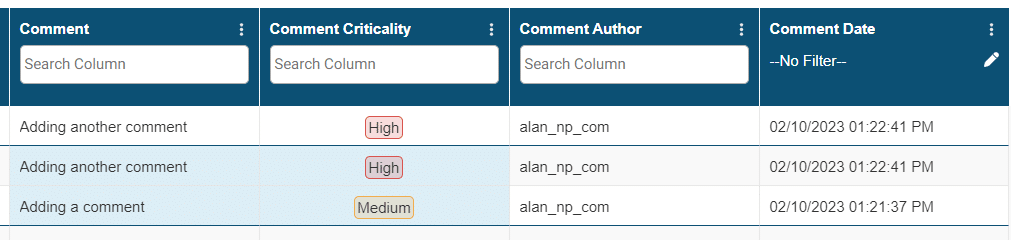
Adding a Comment: Comments can be added to a row by double-clicking on the cell in the column “Comment”. Comment text and status can be added and then saved with the save button. Once the comment is saved, the author and time stamp are automatically inserted.
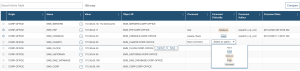
*applying comment
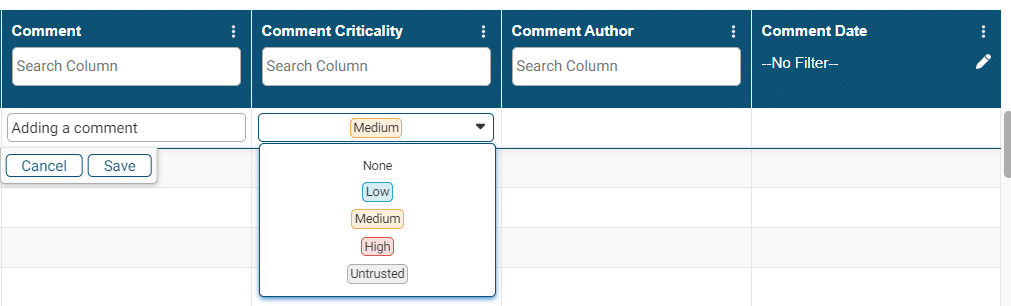
*applying comment – closeup
 Comment History: Additional comments can be added to a row to begin creating a lineage or history of comments. This history will be automatically available when more than one comment exists on a row and can be expanded by clicking the blue clock icon on the leftmost column of the table. If there is no history the icon will be disabled.
When viewing history, changes between lines are highlighted in blue.
Example: If Comment 1 is: “Check This” – ‘medium’ and Comment 2 is “Check This” – ‘low’ the criticality cell would be highlighted because there was a change – the comment text would not be highlighted because it remained the same.
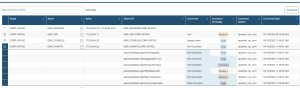
*Viewing comment history
*Viewing comment history – closeup
Object Groups Hash
Object groups are uniquely tagged (Object ID) within NP-View for linkage to comments. More info in the expanded section below.
Comparison Report
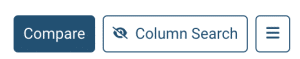
Access Rules and Object Groups have a Compare function to show historical differences in data that has been added or removed. The function can be engaged by clicking the “Compare” button located at the top of the page. This function is used to display changes over a period of days.
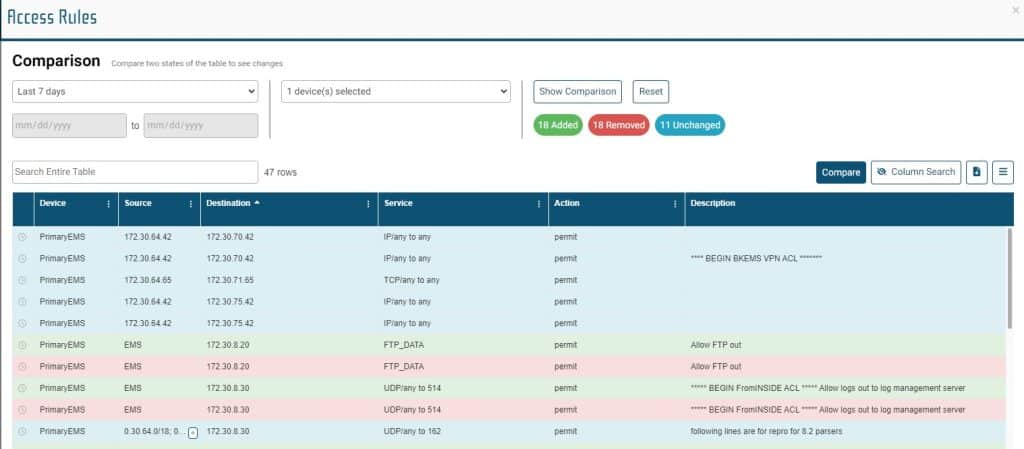
The user can select a time frame (7, 30, 90 or 356 days or a custom date range). The user can select one or more devices to include in the report and then show the history over the range. Once the parameters are selected, the “Show Comparison” button should be selected.
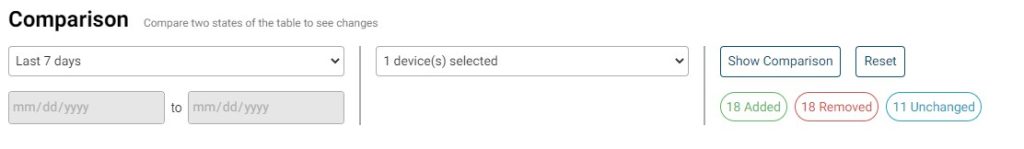
The comparison function will display all changes (Rule Adds, Rule Removal and Unchanged Rules) for the selected days. The data will be displayed using the column format of the selected table. The user can filter on added, removed or unchanged rules by clicking the jelly bean. Added rules will be highlighted in green, removed rules will be highlighted in red and unchanged rules will be highlighted in light blue.
Clicking the “Compare” button will revert to the normal table but will not clear the selections.
Clicking the “Reset” button will clear the selections and reset the table.
Expanded Object Groups
In the Access Rules table, Source, Destination and Service groups can be expanded to see the group details. By clicking on the + icon within a cell, the expanded group information can be made visible.